
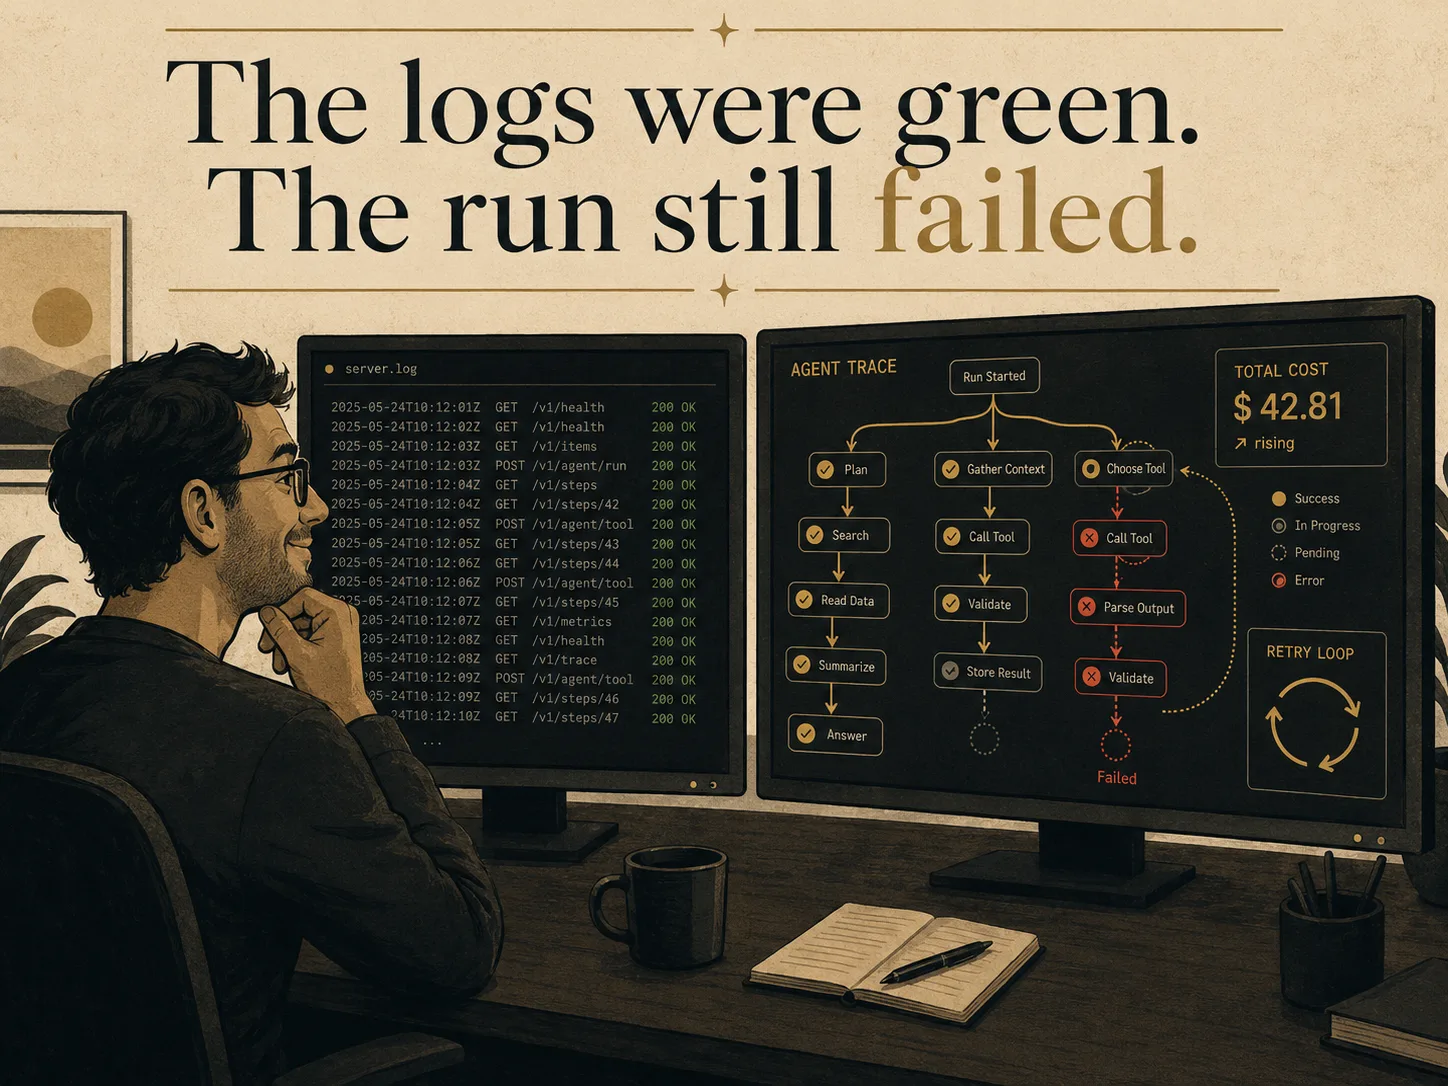
You check the logs. Every line reads 200 OK. No errors, no timeouts, no exceptions. By every measure a monitoring dashboard is built to show, the run was clean. But the agent returned the wrong answer, with complete confidence. It looped through the same retrieval step three times before landing on a response. The total cost was $8.73. The logs never showed any of that.
That gap between what the logs call clean and what the agent actually did is what this article is about. A request log records execution: which function ran, which API returned 200, how many milliseconds the round trip took. For deterministic software that record is usually enough, because the code path and the behavior are the same thing. For an agent, they are not. The agent adds a reasoning layer between input and action, and that layer is where the failures live. It does not appear in a request log.
Agent observability means capturing something different: the full run trace, from task intent through every model decision, tool call, retrieval step, and intermediate result, to the final output and a judgment on whether the outcome was correct. The sections that follow cover the nine signal layers an agent generates, the shift from log line to trace, the tool landscape, and what to instrument first. The foundation comes first: why logs fail, and what a trace is built to show that a log never could.
Why request logs were never enough for agents
A request log assumes a deterministic system. Send request A, the code runs the same path, return response B. If something went wrong, the error is in the log. If nothing is in the log, nothing went wrong. That assumption is load-bearing for traditional software observability, and it breaks immediately with agents.
An agent is a non-deterministic decision tree. The same input can take a different path and reach a different, wrong decision on the next run. The model decides which tool to call, with which arguments, in what order, and whether to continue or stop. Those decisions are not recorded in a request log. What is recorded is that the tool was called and returned 200. The decision to call it at all, the reasoning behind it, whether the result was actually relevant to the task, whether calling it three times was a sign of a loop or a correct retry strategy: none of that is in the log.
This is the gap that sits underneath why agentic demos fail in production: you cannot debug a decision you cannot see. A request log records the last mile of execution; it cannot record the reasoning that chose that execution path, and the reasoning is where agents fail.
The instrument you need is not a better log line. It is a trace: a complete record of the run, with the model’s decision at each step captured alongside the execution. What tool did the model choose, and what context did it see when it chose. What the retrieved content actually contained. What intermediate result the model reached before the next step. Whether the final answer addressed the task as stated, not just whether it returned a 200.
| Request-response | Agent decision tree | |
|---|---|---|
| Structure | Linear: request in, code runs, response out | Non-linear: the model decides the next step at each node |
| Same input, next run | Same code path, same output | Different decision possible, different outcome possible |
| What a log captures | The full code path: every function call is visible | Tool calls and response codes only; model decisions between them are invisible |
| Where failures hide | In the log: exceptions, error codes, timeouts | In the decisions: a wrong tool choice returns 200 and leaves no trace |
| Debug question | Which function threw an error? | Which decision was wrong, and what did the model see when it made it? |
The signals you are actually missing
A request log captures roughly the bottom of a stack. The agent called a tool; the tool returned 200. That is what the log sees. An agent run generates nine layers of signal: task intent, model decisions, tool calls, retrieved context, intermediate steps, permission checks, cost and token spend, retries and loops, and the final business outcome. A log sees one or two of them. The sections below take each layer in turn and show what it surfaces that a plain log does not.
Task intent. Task intent is what the user actually asked the agent to accomplish, stated as a goal, not as prompt tokens. A log records that a request arrived; it does not record what success would look like for that request. In the contract-clause example, the goal was “summarise clause 4 accurately.” Without capturing that intent, you have no basis for judging whether any step of the run moved toward it or away from it.
Model decisions and reasoning. At each step the model chose which action to take next: call retrieve, call respond, loop again, or stop. A log records that the call happened; it does not record the choice that produced it. Capturing the model’s decision at each step, along with the context it saw when it decided, is what lets you later ask whether the choice was correct rather than just whether the execution ran.
Tool calls. Tool calls are the exact tool invoked, the arguments passed, and the result returned. A log may record that /tool/retrieve returned 200; it does not record that the query argument pointed to the wrong clause number or that the returned document had a relevance score of 0.21. A 200 with the wrong arguments is a failure that the status code cannot show.
Retrieved context. Retrieval is where the contract-clause loop broke. Each of the three retrieve calls returned a different section of the contract, not clause 4. Without capturing what was actually retrieved, and how relevant the content was to the query, the loop looks like three successful fetches. With that capture it is immediately visible that the retrieval step was not converging.
Intermediate steps. In a multi-step run, the intermediate steps are the partial results the agent built up before the final output. Capturing them lets you see where a plan went off course, not just that the final answer was wrong. A run that reached a wrong intermediate conclusion three steps before the final output looks very different on a trace than it does on a log.
Permission and guardrail checks. Every action the agent attempted, and whether it was allowed, belongs in the trace. A permission block that fired without being logged is a safety event with no audit trail. A guardrail that was bypassed shows up only if the check was instrumented. For any agent with real side effects, this layer is the evidence you need to show the system stayed within its bounds.
Cost and token spend. The $8.73 on the contract-clause run never appeared in the log. It was spread across three retrieve calls and a respond call, and no single HTTP response carries the cumulative token count for the run. Capturing cost and token spend per step and per run is the only way to know whether a run was within budget, and whether a loop or an over-long context window was the cause when it was not.
Retries and loops. Three retrieve calls for the same task can mean the retrieval is correctly retrying after a transient failure, or it can mean the agent is stuck. A log records that the call happened three times; it does not record why. A trace that includes the retrieval result and relevance score at each attempt can distinguish a converging retry from a diverging loop in the same data.
Final business outcome. The last layer is not a signal the agent emits automatically: it is a scored judgment that the task was completed correctly by a business definition, not just that a response was returned. For the contract-clause case, that means the summary covered clause 4, not another clause. Without an outcome score, every run that returns a response looks like a success, and the real failure rate is invisible.
A log answers one question: did it run. These nine layers answer the question that matters for an agent: did it decide well, at every step, within budget, and with the right result at the end.
From log line to trace
The previous section named nine signal layers. This one shows how they get captured together. The unit of observability shifts from the request to the trace: the complete record of a single run, from first input to final outcome. Each action the agent takes is recorded as a span, with timing, inputs, outputs, token cost, and any errors. All spans share a single trace ID and nest to reflect the structure of the run: a parent “agent run” span contains child spans for every tool call, retrieval, and model decision. A trace is a replay of what the agent decided and in what order, without reconstructing it from scattered log entries.
The nesting is what changes the picture. A flat log records that retrieve was called three times. A trace records each retrieve call as a child span of the parent run, with its own arguments, its own result, and its own relevance score. The loop is not inferred from a pattern in the log; it is visible in the structure. Three sequential retrieve spans with scores below 0.25, all returning the same document, read as a stuck loop at a glance.
The figure below shows the contract-clause run as a trace. The parent span covers the whole run, labelled “agent run: summarise contract clause 4” and tagged with 2.4 seconds and $8.73 total. Inside it, in sequence: an intent span (the agent’s understanding of the goal), three retrieve spans (each with its relevance score, its result, and its share of the cost), a respond span (the model generating the final answer), and an outcome span (the judgment that the answer was wrong). The three retrieve spans form a visible cluster: costs of $1.82, $2.14, and $1.93; relevance scores of 0.21, 0.19, and 0.22; the same wrong document each time. On the flat log, those three calls returned 200 and left no record worth investigating. On the trace, they are a loop that spent $5.89 retrieving the same unhelpful document three times before the model answered anyway.
The telemetry layer is converging on a common substrate. OpenTelemetry’s GenAI semantic conventions define how spans for LLM calls, tool invocations, and agent operations should be structured so that traces are portable across backends without re-instrumentation. The conventions are still pre-release and actively maturing, but the major observability platforms and agent frameworks are already aligning to them. That portability is worth factoring in when choosing an instrumentation approach.
The trace does not fix the run. It makes the run legible, and legibility is the prerequisite for every fix that follows: adjusting the retrieval query, adding a loop guard, capping the per-run budget, or tightening the respond prompt. Without the trace, the run returned a confident 200 and left no record of what went wrong. With it, the cause and the cost are in the same artifact.
The tooling landscape: open-source and paid
The right question when choosing an agent observability stack is not which tool wins a feature comparison. It is which signal layers you need to cover and whether you want to manage the infrastructure yourself. The landscape splits into open-source or source-available options and managed paid platforms, and several in each category now instrument the major agent frameworks out of the box.
On the open-source side, Langfuse (MIT) is one of the most actively maintained options, covering traces, model decisions, tool calls, RAG context, cost and token spend, and an evaluation layer; it became part of the ClickHouse ecosystem in early 2026 and is explicitly self-hostable. Arize Phoenix is source-available under the Elastic License v2 (ELv2, not an OSI-approved open-source license), with strong RAG evaluation and built-in hallucination and faithfulness metrics. OpenLLMetry is OTel-native from the start, instruments 20-plus LLM providers and vector databases, but has no built-in evaluation layer; it fits teams that already have an OTel backend and want to add LLM instrumentation without adopting a new platform. W&B Weave instruments at the function level via a decorator, captures traces and tool calls, and includes evaluation support; it is a natural fit for teams already using Weights and Biases for experiment tracking. AgentOps is agent-specific, supports 400-plus LLMs and major frameworks, adds session-replay-style time-travel debugging, and covers cost, retry tracking, and evaluations. MLflow brings OTel-based tracing, evaluation support, and cost tracking via its AI Gateway; it is the natural choice for teams already running MLflow infrastructure.
On the paid side, LangSmith is the fastest path to agent traces for LangChain and LangGraph teams, also accepts OTel so it is not locked to the LangChain stack, and covers traces, tool calls, RAG context, cost, and evaluations. Datadog LLM Observability layers LLM and agent tracing on existing Datadog APM, adds PII and hallucination detection at the guardrail layer, and supports OTel GenAI semantic conventions natively; it is the natural choice for teams already on Datadog. Braintrust focuses on evals with quality gates and real-time trace inspection, ships a Topics feature for automatic failure-pattern discovery, and offers hybrid deployment for teams with data residency requirements. Arize AX is the managed enterprise tier built on the same OTel standards as Arize Phoenix, adding online evals and managed infrastructure for teams that want Phoenix-style evaluation without the self-hosting overhead.
The telemetry layer is converging on OpenTelemetry, as noted in the trace section above. Portability across backends without re-instrumentation is a realistic expectation as more platforms adopt the GenAI semantic conventions natively.
One tool worth noting separately is Helicone, an open-source AI gateway and proxy that logs API calls, tracks cost and latency, and is actively maintained. It is useful for teams that want API-level logging quickly. But it sits at layer 3 of the nine-layer stack and does not natively capture multi-step agent reasoning, tool-call graphs, or RAG retrieval context at the span level. It is a complement to an agent observability platform, not a substitute.
| Tool | Type | Traces + decisions | Tool calls | Retr. context | Cost / tokens | Guardrails | Evals / outcome | Self-host |
|---|---|---|---|---|---|---|---|---|
| Langfuse | OSS (MIT) | yes | yes | yes | yes | - | yes | yes |
| Arize Phoenix | Src-avail. (ELv2) | yes | yes | yes | - | - | yes | yes |
| OpenLLMetry | OSS (Apache 2.0) | yes | yes | yes | - | - | - | yes |
| W&B Weave | OSS (Apache 2.0) | yes | yes | - | - | - | yes | yes |
| AgentOps | OSS (MIT) | yes | yes | - | yes | - | yes | yes |
| MLflow | OSS (Apache 2.0) | yes | yes | yes | yes | - | yes | yes |
| LangSmith | Paid | yes | yes | yes | yes | - | yes | - |
| Datadog LLM Obs. | Paid | yes | yes | yes | yes | yes | yes | - |
| Braintrust | Paid | yes | yes | - | yes | - | yes | - |
| Arize AX | Paid | yes | - | - | - | yes | yes | - |
What to instrument first
Nine layers can feel like a lot to instrument at once. In practice the order matters more than completeness, and the starting sequence that works is the same regardless of the platform you choose.
Start with the full run trace and tool-call spans. This is the artifact that lets you replay what the agent did end to end: the parent span for the whole run, child spans for each tool call, and the model decision at each step. For the contract-clause run, a trace would have shown the three retrieve calls and their relevance scores immediately, instead of three 200 OKs that implied nothing was wrong. Nothing else in the observability stack is worth building until you can replay a failed run and see what the agent decided at each step.
Add cost and token tracking in the same pass. Token spend is a property of the run, not an afterthought. The $8.73 on the contract-clause run was only visible once cost was captured per span. Without it, the only signal is that the run completed, which is true of the contract-clause failure too. Cost also surfaces loops before they reach user feedback: a run that should cost $0.40 and costs $2.80 is worth catching in the trace, not in a billing alert.
Next, add outcome-level evaluation: a score or label that answers whether the agent actually completed the task correctly, not just whether it returned a response. For the contract-clause case, that means scoring whether the summary covered clause 4 specifically. Without this layer, every run that produces output looks like a success, and the real failure rate stays invisible. The eval does not have to be perfect on day one: a binary correct/incorrect label on a sample of runs gives you a signal you can act on.
Fourth, add guardrail and permission checks, especially if the agent has real side effects: writes, sends, deletes, or calls external services. For a read-only contract analysis agent the blast radius of a wrong decision is low; for an agent that drafts and sends emails, it is not. Instrument what the agent was allowed to do and what was blocked, and make sure that record is in the trace.
Fifth, tune per-step latency and retry counts once the basics are working. These matter for user experience and for catching subtle loops, but they are not the first thing to look at on a system that has not yet proven it makes correct decisions. Latency per step is useful when you are optimizing a system that is already mostly right; it is noise when you are still determining whether the agent gets the task correct at all.
This instrument-first order is exactly what a production-readiness review covers before an agent goes live, and it is one of the structuring frameworks in Designing Enterprise Agentic AI Systems. The same priority shows up in a different context when you look at why voice AI agents are harder than chatbots: the voice pipeline adds a per-step latency dimension that makes the starting sequence even more consequential.
If you are working out what to instrument first, or trying to read a trace and figure out what it is telling you, that is the kind of scoping work I do with teams in a readiness review. Details at how I can help.
Frequently asked
Quick answers
- What is AI agent observability?
- AI agent observability is the practice of capturing and analyzing the layered signals that explain what an agent decided and why, not just what it executed. Where traditional software observability focuses on requests, errors, and latency, agent observability extends to task intent, model reasoning steps, tool selections and their arguments, retrieved context, intermediate decisions, guardrail checks, cost and token spend, retry behavior, and the final business outcome. The goal is to make a non-deterministic, multi-step system understandable and debuggable from the outside.
- Why are logs not enough for AI agents?
- Logs record what the system executed: which function ran, which API returned 200, which database row was written. For traditional software that is usually sufficient, because the logic is deterministic and the code path explains the behavior. An agent adds a reasoning layer between input and action: the model decides which tool to call, with which arguments, in what order, and whether to stop or continue. That reasoning is what fails in production, and it does not appear in a request log. You need a trace of the model decision points, not just a record of what ran.
- What should you monitor in an AI agent that you do not in normal software?
- The signals unique to agents are: task intent (what the user actually asked the agent to accomplish), model decisions at each step (which action the model chose and the reasoning behind it), tool calls with their exact arguments and results, the context retrieved from knowledge bases and how it influenced the decision, intermediate steps when a multi-step plan unfolds, permission and guardrail checks that bound what the agent is allowed to do, cost and token spend per run, retry and loop counts, and outcome-level evaluation that scores whether the task succeeded by a business definition, not just whether it returned a response. Traditional APM gives you the last mile; agent observability gives you the reasoning before it.
- What is a trace in agent observability?
- A trace is the complete record of a single agent run, from the initial user request through every decision, tool call, retrieval, and intermediate step, to the final output and outcome. Each action in the run is captured as a span inside the trace, with timing, inputs, outputs, cost, and any error information. A run that loops three times, calls two tools, and retrieves context from a knowledge base will have spans for each of those events, linked in sequence under a single trace ID. The trace is the primary debugging artifact in agent observability because it lets you replay exactly what the agent did and in what order, without reconstructing it from scattered log entries.
- What open-source tools exist for agent observability?
- Open-source platforms built around tracing and evals exist and are actively maintained. The category has matured enough that several options instrument the major agent frameworks out of the box, capture multi-step traces, track cost and token spend, and include evaluation layers that score whether the agent completed the task correctly. The underlying telemetry is converging on OpenTelemetry, which means traces can be exported to a range of backends. For a team choosing an observability stack, the right starting question is not which product to pick but which signal layers you need to cover first and whether you want to self-host the infrastructure.
- What should I instrument first?
- Start with the full run trace and tool-call spans so you can replay what the agent did end to end. Add cost and token tracking in the same pass, since budget overruns are often the first production blocker. Once you can see what the agent did and what it cost, add outcome-level evals: a score or label that answers whether the agent actually completed the task correctly, not just whether it returned a response. Guardrail and permission checks come next, especially if the agent can take actions with real side effects. Latency per step and retry counts are useful once you have the basics covered and are tuning a system that is already mostly working.